
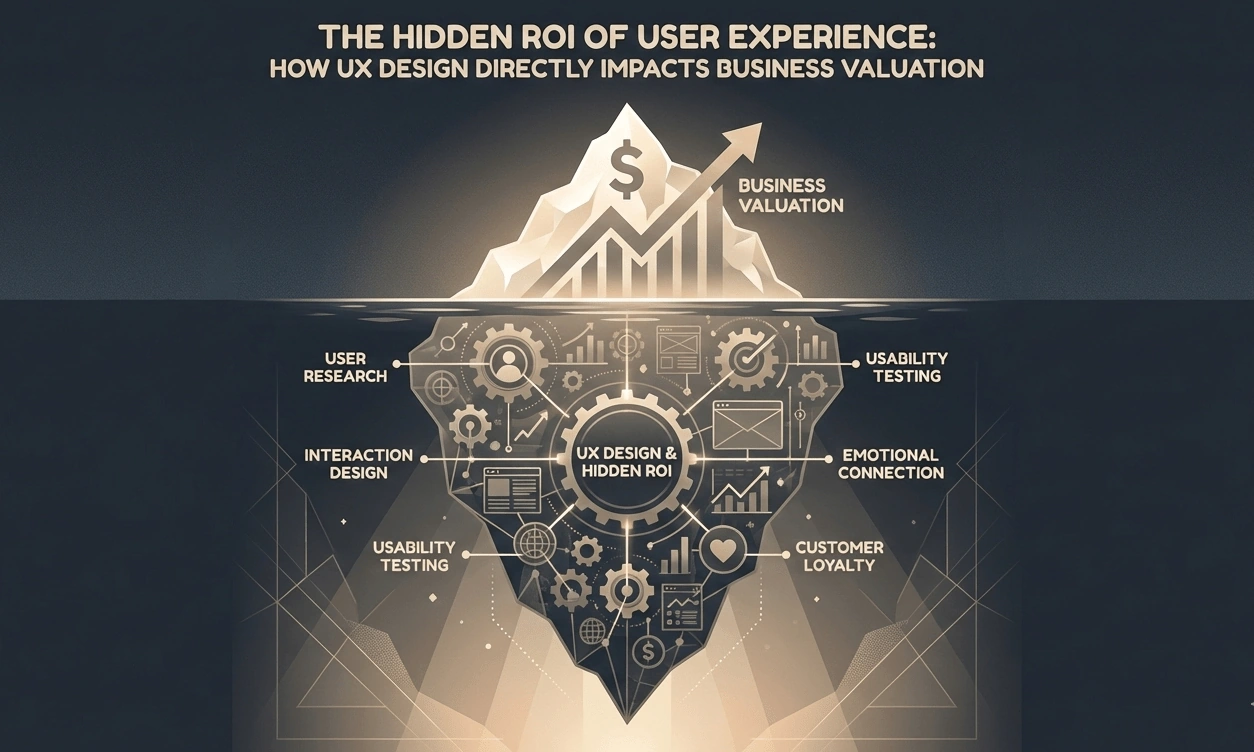
In boardrooms across the globe, a critical conversation is missing. While CFOs scrutinize every line item and investors pour over financial statements, the single most powerful driver of sustainable growth often goes unquantified: user experience design.
This isn't another article about making buttons prettier or choosing the right shade of blue. This is about understanding how UX ROI directly translates into business valuation—and why companies that master user experience design consistently command premium multiples when it's time for acquisition or investment.
"Design is not just what it looks like and feels like. Design is how it works."
— Steve JobsThe hidden truth? Superior UX is the ultimate signal of operational excellence. When potential buyers or investors evaluate your company, they're not just looking at revenue—they're assessing the machinery that produces it. And nothing reveals that machinery's efficiency quite like the experience you've crafted for your users.
Quantifying the Financial Value of UX
Before we can discuss UX ROI in valuation terms, we need to establish a framework for measurement. The challenge has never been that UX doesn't create value—it's that organizations struggle to articulate that value in the language finance teams understand.
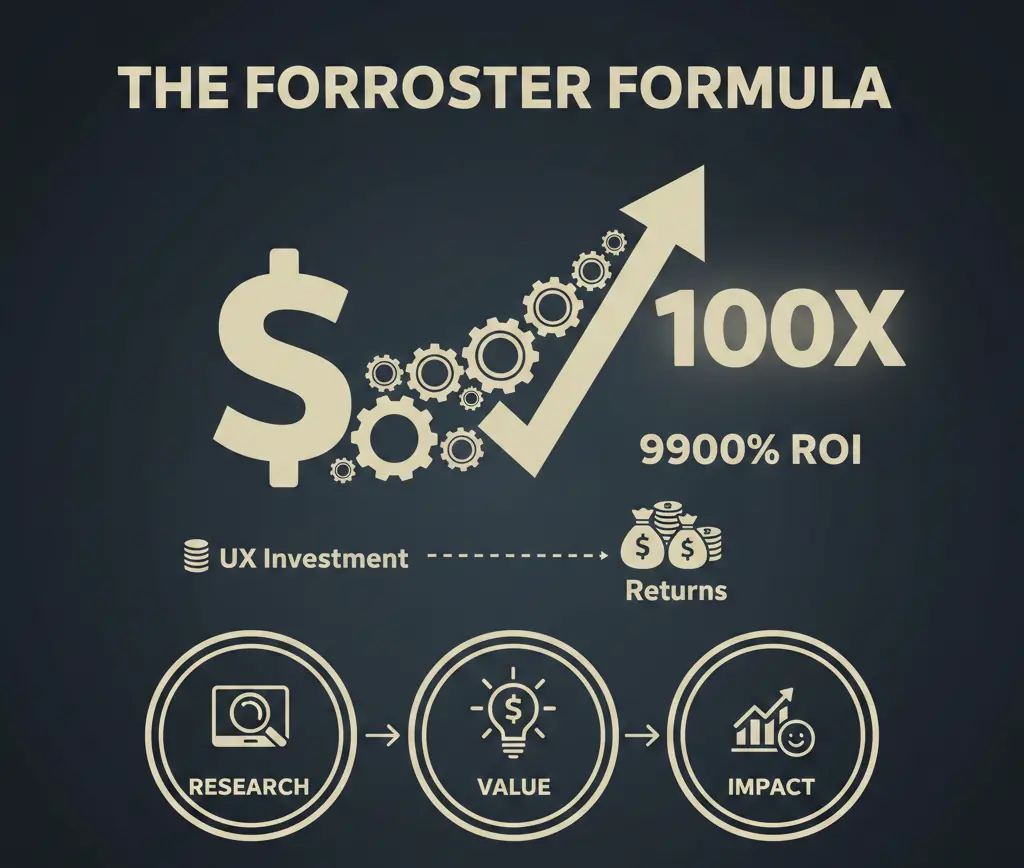
The Forrester Formula
Research from Forrester reveals that every dollar invested in UX returns $100—a staggering 9,900% ROI. But this headline figure only scratches the surface. The real value lies in understanding where that return materializes:
Primary Value Drivers of UX Investment
- Revenue Improved conversion rate optimization directly increases top-line growth
- Retention Reduced churn extends customer relationships and compounds LTV
- Efficiency Lower support costs from intuitive interfaces reduce operational burden
- Velocity Faster development cycles through design systems reduce time-to-market
The McKinsey Design Index
McKinsey's landmark study tracking 300 publicly listed companies over five years found that design-led companies outperformed industry benchmarks by 2:1. More importantly for valuation discussions, these companies showed:
Higher revenue growth compared to industry peers
Higher total returns to shareholders
These aren't marginal improvements—they represent the difference between market leaders and market followers. For investors evaluating potential acquisitions, this data transforms UX from a "nice-to-have" into a due diligence requirement.
UX as a Signal of Operational Excellence
When private equity firms or strategic buyers evaluate acquisition targets, they're fundamentally assessing risk. Superior user experience design serves as a powerful proxy for organizational capabilities that are difficult to evaluate directly.
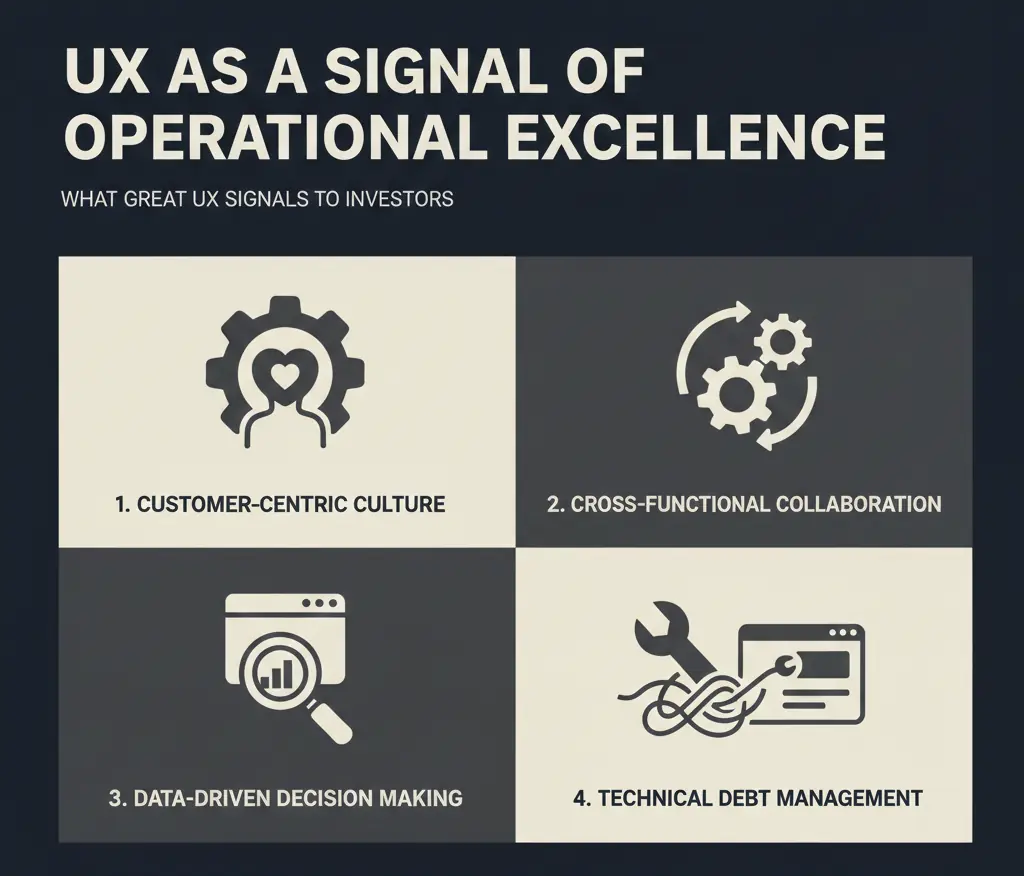
What Great UX Signals to Investors
1. Customer-Centric Culture
Companies that invest in UX demonstrate they prioritize customer needs over internal convenience. This cultural orientation correlates with sustainable growth and defensible market positions.
2. Cross-Functional Collaboration
Exceptional customer experience strategy requires alignment between design, engineering, product, and business teams. This coordination capability is a leading indicator of execution excellence.
3. Data-Driven Decision Making
Modern UX practices rely on continuous testing and iteration. Organizations with mature UX functions have typically developed sophisticated analytics capabilities that drive intelligent resource allocation.
4. Technical Debt Management
A polished user experience suggests disciplined engineering practices. Conversely, UX friction often indicates underlying technical debt that will require post-acquisition investment.
"In due diligence, we use the product experience as a leading indicator of engineering quality. If the UX is inconsistent or frustrating, we know we'll find technical debt underneath."
— Partner, Growth Equity Firm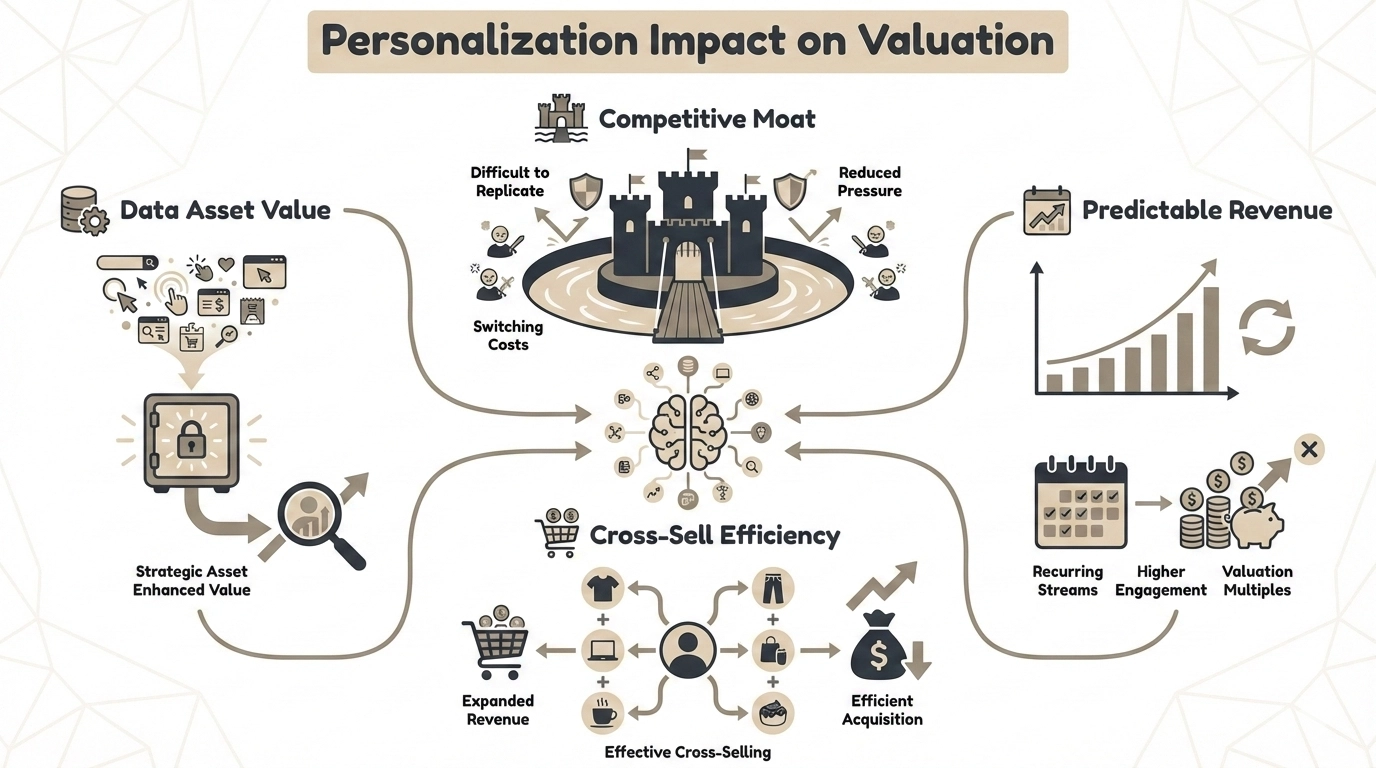
Personalization: The UX Multiplier
Among all user experience design investments, personalization delivers outsized returns. When executed well, it transforms generic interactions into tailored experiences that dramatically impact both acquisition and retention economics.
The Economics of Personalized UX
of consumers more likely to purchase with personalized experiences
revenue increase from personalization implementation
ROI on personalization marketing spend
Personalization Impact on Valuation
From a business valuation perspective, personalization capabilities contribute to valuation through several mechanisms:
- Data Asset Value: The behavioral data collected to power personalization represents a strategic asset that enhances the value of customer relationships.
- Competitive Moat: Sophisticated personalization is difficult to replicate, creating switching costs and reducing competitive pressure on margins.
- Predictable Revenue: Higher engagement and retention from personalized experiences create more predictable, recurring revenue streams—the holy grail for valuation multiples.
- Cross-Sell Efficiency: Personalization engines that drive effective cross-selling expand revenue per customer without proportional increases in acquisition cost.

Accessibility: Compliance as Competitive Advantage
ADA compliance and accessibility often appear in budget discussions as regulatory costs. This framing misses the strategic opportunity entirely. Accessibility investment in user experience design simultaneously reduces legal risk, expands addressable market, and improves UX for all users.
The Business Case for Accessibility
Market Expansion
Over 1 billion people globally live with some form of disability. In the US alone, this population controls $490 billion in disposable income. Accessible design unlocks access to this underserved market segment.
Beyond direct disability populations, accessibility improvements benefit:
- • Aging populations with declining vision or motor control
- • Users in challenging environments (bright sunlight, noisy spaces)
- • Mobile users with temporary situational limitations
- • Non-native speakers who benefit from clear, simple interfaces
Legal Risk Mitigation
ADA-related lawsuits targeting websites have increased dramatically, with over 4,000 digital accessibility lawsuits filed in 2023 alone. For companies approaching acquisition or IPO, accessibility compliance is increasingly a due diligence requirement.
"We now include accessibility audits in every technology due diligence. Non-compliance represents both immediate legal liability and signals broader technical debt."
— Technology Due Diligence Lead, Big Four FirmSEO and Performance Benefits
Accessibility best practices align closely with SEO requirements. Semantic HTML, descriptive alt text, logical heading structures, and keyboard navigability all contribute to improved search rankings. Google's Core Web Vitals increasingly reward accessible, performant sites—creating a direct link between accessibility investment and organic traffic acquisition.
Real-World Accessibility Impact
Case Study: E-Commerce Platform
A mid-sized online retailer invested $150,000 in comprehensive accessibility improvements including screen reader optimization, keyboard navigation, and color contrast adjustments.
Result: Payback achieved in 8 months. The accessibility improvements also benefited mobile users and low-bandwidth users, expanding total addressable market.
Mobile Experience: The Revenue Multiplier
With mobile traffic now exceeding desktop across most industries, mobile user experience design has become the primary battlefield for conversion rate optimization. Yet many organizations still treat mobile as an afterthought, leaving substantial value unrealized.
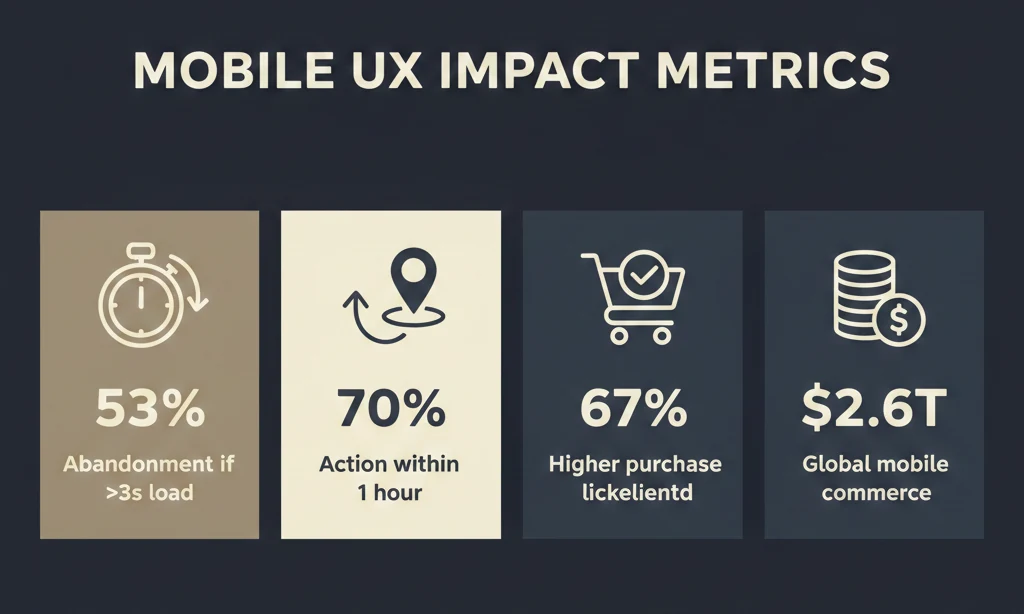
Mobile UX Impact Metrics
of mobile visitors abandon sites that take longer than 3 seconds to load
of mobile searches lead to action within one hour
higher likelihood to purchase from mobile-friendly sites
in annual mobile commerce revenue globally
Critical Mobile UX Factors
Performance Optimization
Every 100ms improvement in load time increases conversion by 1.1%. For high-volume sites, this translates to millions in additional revenue.
Touch-First Design
Properly sized touch targets, intuitive gestures, and thumb-friendly navigation reduce friction and increase task completion rates.
Progressive Enhancement
Experiences that gracefully degrade for slower connections expand addressable market in emerging economies where mobile growth is fastest.
Checkout Optimization
Mobile checkout abandonment rates exceed 85%. Each step removed from checkout flow can increase conversion by 10%+.
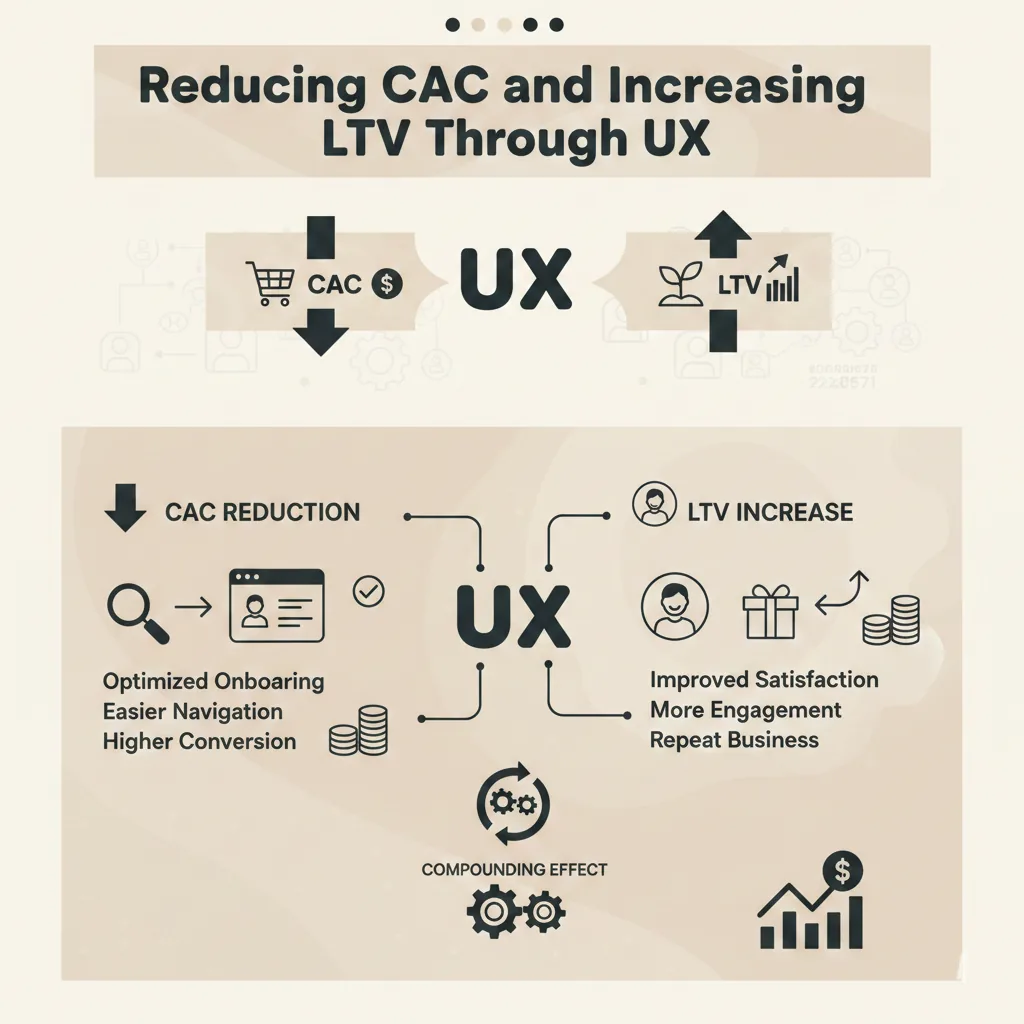
Reducing CAC and Increasing LTV Through UX
The ultimate financial impact of user experience design manifests in two critical metrics that drive business valuation: Customer Acquisition Cost (CAC) and Lifetime Value (LTV). Superior UX improves both simultaneously, creating a compounding effect on unit economics.
How UX Reduces Customer Acquisition Cost
- Higher Organic Conversion: Better UX means more visitors convert, reducing the number of paid impressions required per customer.
- Word-of-Mouth Amplification: Delightful experiences generate referrals, creating free acquisition channels.
- Reduced Sales Friction: Self-service capabilities enabled by intuitive UX reduce sales team dependency.
- Lower Bounce Rates: Engaging experiences retain paid traffic longer, improving ad quality scores and reducing CPC.
How UX Increases Lifetime Value
- Reduced Churn: Customers who can easily accomplish their goals have no reason to seek alternatives.
- Increased Usage: Frictionless experiences encourage deeper product adoption and feature discovery.
- Expansion Revenue: Satisfied users are more receptive to upsells and cross-sells.
- Support Cost Reduction: Intuitive interfaces generate fewer support tickets, improving net revenue per customer.
The Valuation Impact of LTV:CAC Ratio
SaaS companies are typically valued based on revenue multiples, but sophisticated investors adjust these multiples based on unit economics. A company with a 5:1 LTV:CAC ratio will command significantly higher multiples than one with 3:1—often 30-50% higher valuation at the same revenue level.
UX-Driven Unit Economics Improvement
Making the Business Case to CFOs
Understanding UX ROI is only half the battle. The other half is communicating that value in terms that resonate with financial decision-makers. Here's a framework for presenting UX investments in the language of finance.
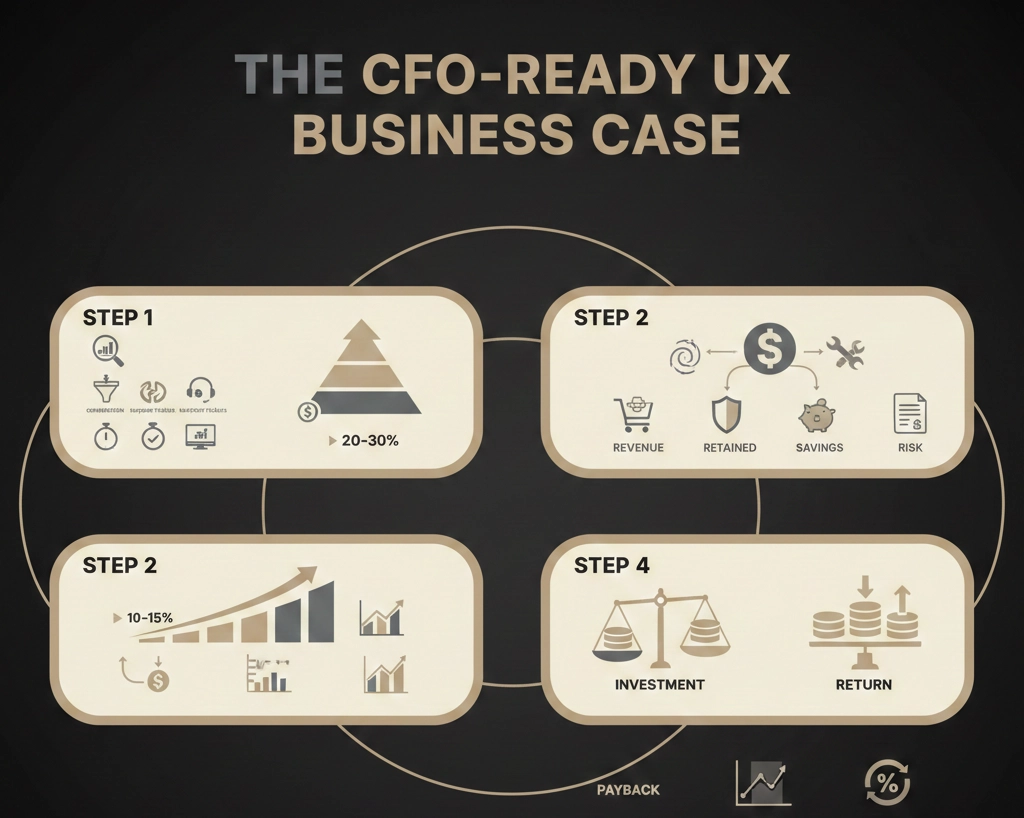
The CFO-Ready UX Business Case
Step 1: Baseline Current State Metrics
Document quantifiable metrics that UX improvements will impact:
- • Current conversion rates by funnel stage
- • Churn rates and reasons for cancellation
- • Support ticket volume and resolution costs
- • Task completion rates for critical user journeys
- • Mobile vs. desktop performance gaps
Step 2: Quantify Improvement Potential
Use industry benchmarks and competitive analysis to project realistic improvements:
- • Conservative estimate: 10-15% conversion improvement
- • Moderate estimate: 20-30% churn reduction
- • Aggressive estimate: 40%+ support cost reduction
Step 3: Calculate Financial Impact
Translate UX improvements into dollar values:
- • Additional revenue from conversion improvements
- • Retained revenue from churn reduction
- • Cost savings from support efficiency
- • Risk mitigation value from compliance improvements
Step 4: Present Investment vs. Return
Frame the request in familiar financial terms: initial investment, payback period, NPV, and IRR. Include sensitivity analysis showing returns under conservative, moderate, and aggressive scenarios.
Key Phrases That Resonate
- "This investment improves our unit economics."
- "Better UX reduces our customer acquisition cost."
- "We're leaving revenue on the table with current conversion rates."
- "This positions us better for our next fundraise/exit."
- "Competitors are already investing here."
Conclusion: UX as Strategic Asset
The evidence is unequivocal: user experience design is not a cost center—it's a strategic asset that directly impacts business valuation. Companies that treat UX as an afterthought are systematically undervalued compared to those that recognize its role as a driver of revenue, efficiency, and competitive advantage.
For UX designers and product managers, this perspective shift offers a powerful new vocabulary for internal advocacy. By framing design decisions in terms of UX ROI, conversion rate optimization, and customer experience strategy, you can build alignment with financial stakeholders and secure the investment necessary to deliver exceptional experiences.
For investors and acquirers, UX quality has become a leading indicator of organizational capability and growth potential. Due diligence that ignores user experience misses a critical signal about the sustainability and scalability of the business.
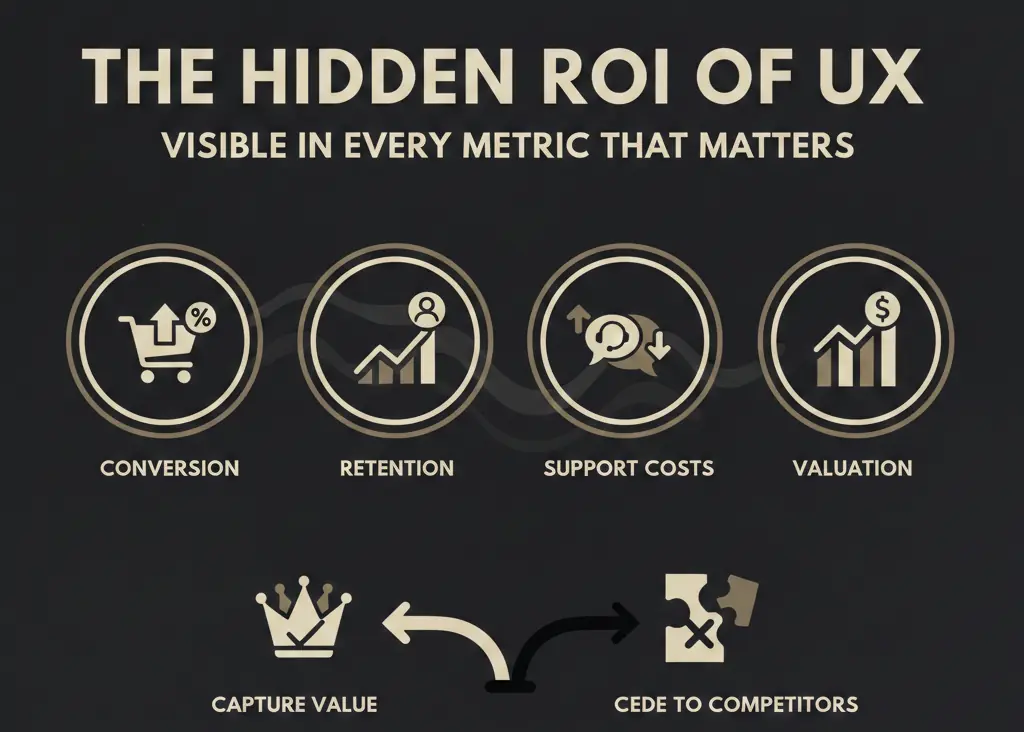
Final Thoughts
The hidden ROI of user experience isn't hidden at all—it's visible in every metric that matters: conversion rates, retention curves, support costs, and ultimately, valuation multiples. The only question is whether your organization will capture that value or cede it to competitors who understand what's really at stake.
In the end, great UX isn't just good design—it's good business.
Frequently Asked Questions
Here are answers to the most common questions we hear about UX ROI and business valuation:
Start with basic metrics: conversion rate, bounce rate, average session duration, and support ticket volume. Most analytics platforms (Google Analytics, Mixpanel, Amplitude) provide free or affordable tiers. Track these metrics before and after UX improvements. Even simple A/B testing of critical user flows can reveal high-impact changes. Don't let perfect be the enemy of good—reasonable estimates based on available data are more valuable than no measurement at all.
Early-stage UX investment creates a compound advantage. A well-designed product acquires customers more efficiently, retains them better, and scales more effectively. When you fundraise or exit, investors will evaluate your unit economics and growth trajectory—both heavily influenced by product UX. Moreover, fixing UX problems later is far more expensive than building them right initially. Think of UX investment as foundational infrastructure that enables everything else.
The classic answer is: enough to impact your most critical metrics. If conversion rate is your bottleneck, prioritize conversion optimization. If retention is the issue, focus there. A typical allocation is 8-12% of product development budget for design and UX research. However, ROI-focused companies often allocate 15-20% because the returns are demonstrably higher. Start with a pilot project in your highest-impact area, measure results, then expand based on proven returns.
UX IS brand perception. Every interaction a customer has with your product shapes their perception of your brand. A polished, intuitive experience signals quality, professionalism, and attention to detail. A frustrating experience signals carelessness. This perception directly impacts willingness to pay, brand loyalty, and word-of-mouth recommendations. For valuation purposes, strong brand perception increases enterprise value by improving customer acquisition efficiency, reducing churn, and supporting premium pricing.
Design systems are force multipliers for UX ROI. They reduce design and development time by 30-40%, improve consistency across the product, and make scaling much more feasible. For investors evaluating acquisitions, a mature design system signals operational efficiency, faster time-to-market capability, and the ability to onboard new team members efficiently. This reduces perceived risk and often translates to higher valuation multiples. It's one of the most underrated assets in tech companies.
Technically yes, but practically no. Acquired companies often face integration challenges, budget constraints, and the need to maintain momentum. Fixing fundamental UX issues post-acquisition typically requires 3-12 months and significant investment. Smart acquirers factor this cost into their offer price, reducing your valuation. It's far better to address UX problems before approaching the market. A company with great UX commands a significant premium—often 20-40% above what buyers would pay for an otherwise identical but poorly designed competitor.
Rigorous user research demonstrates that product decisions are grounded in customer needs rather than internal assumptions. This discipline signals to investors that your organization understands the market and can adapt intelligently. Research-backed design also reduces the risk of building products customers don't want, which is the primary cause of failure in tech startups. Companies with mature user research practices show higher probability of success, which directly impacts valuation multiples.
Mobile-first design is critical for international growth, especially in emerging markets where mobile adoption outpaces desktop usage. Progressive enhancement—ensuring functionality on low-bandwidth connections—opens massive addressable markets. This isn't just better UX; it's better economics. Companies that design for global, mobile-first scenarios expand their TAM and reduce dependency on any single market. This diversification reduces risk and increases valuation multiple.s
About Eteriatech
Eteriatech bridges the gap between UX strategy and web development. We don't just implement designs—we understand the "why" behind every click. Our work helps businesses reduce friction, improve conversion, and build websites users love.